When we talk about displaying data on a website, it’s not enough to show numbers and digits in a table. Nowadays, consumers of such information demand more than plain tables and numbers and, as publishers, we need to offer better ways to show them information by using infographics, good sorting and filtering options, tools to import and export data and more. If you’re looking for plugins to visualize your data on a WordPress site then look no further!
In this article we will review the top 5 best WordPress data visualization plugins.
wpDataTables

wpDataTables is one of the premium WordPress data visualization plugins that lets you add complex data, graphs and charts that look great on both desktop and mobile devices. The plugin offers the option to import data, which can be done by uploading files, transferring from Google spreadsheets, internal or external databases or simply by typing your text into the cells.
wpDataTable is very similar to Excel, so if you already have experience with Microsoft Excel then it will be easier for you to get started with this plugin.
Boasting a wide array of functions, wpDataTables can create different types of tables like Statistical Tables to show complex charts and analytics, Product Tables to show product lists, Pricing Tables to compare different products by features, Finance Tables to display financial reports with many attributes, Amazon Comparison Tables to compare profits by price and by features and even Cryptocurrency Tables to display prices and charts for cryptocurrency.
This plugin is also a good option for working with displayed data, as it offers different ways to filter and sort data in tables by date or any other attribute like location or range of values.
This plugin also has great documentation and friendly support, so this plugin is highly recommended if you’re dealing with complex data.
Pricing starts from $69 and the plugin is compatible with different add-ons to extend its functionality.
Formidable Forms
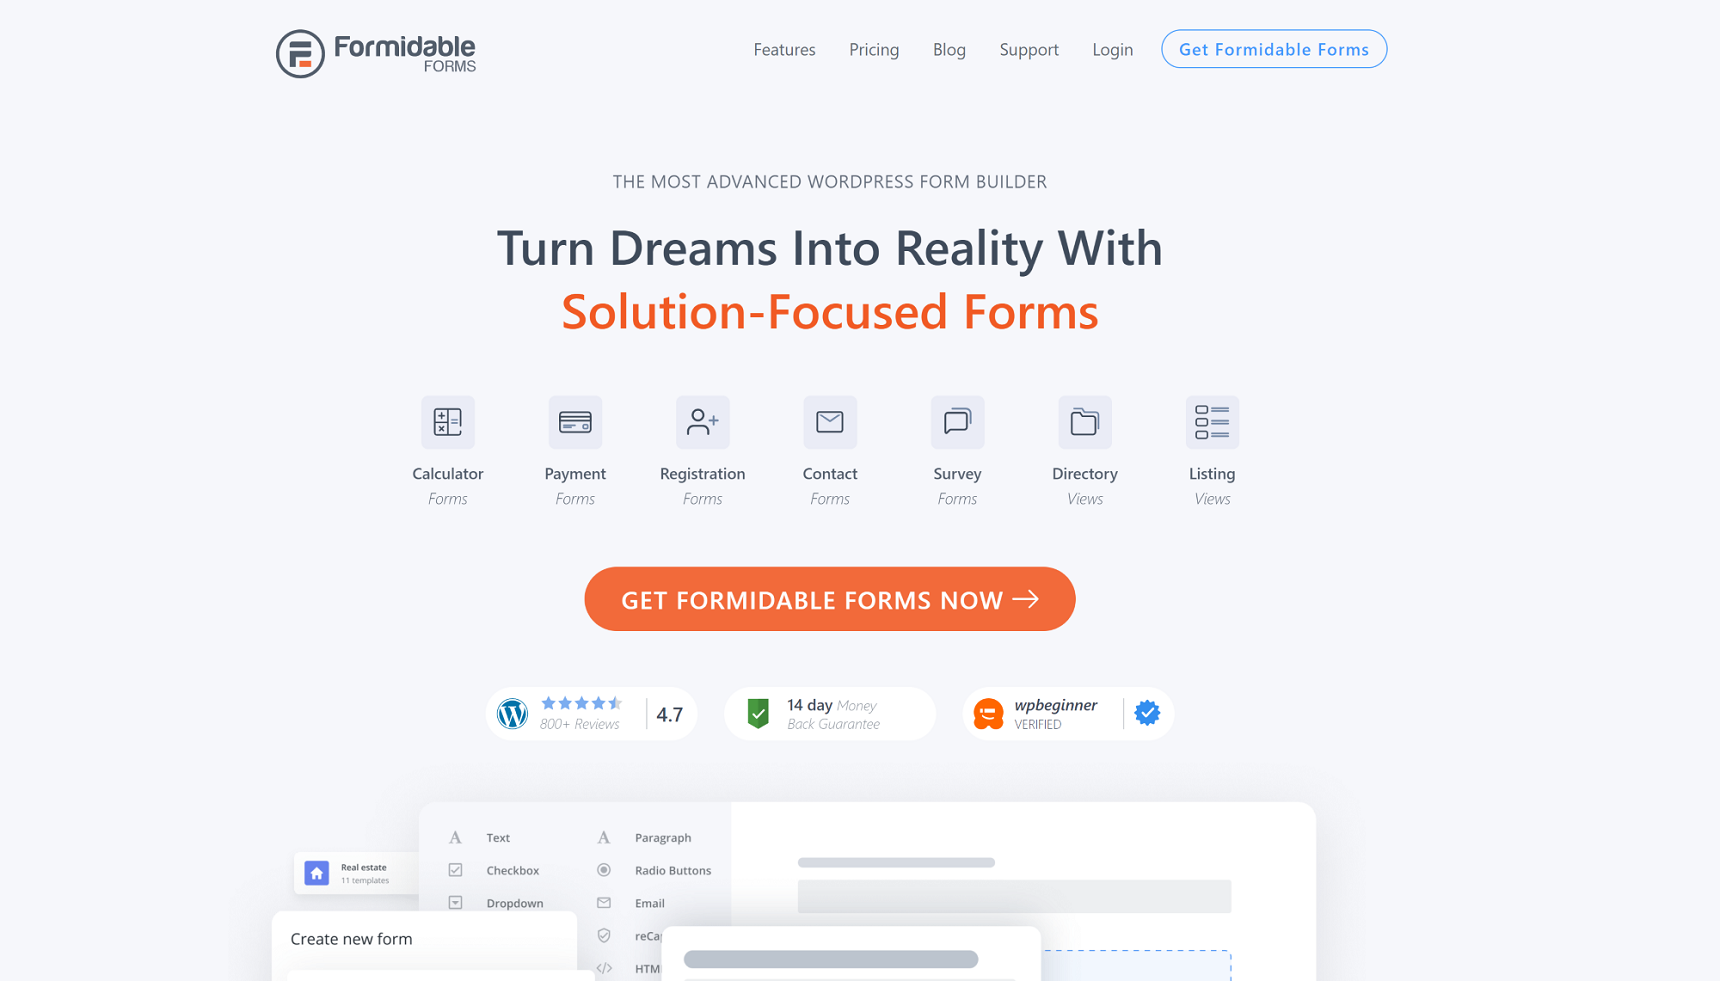
Formidable Forms is unique on this list because it is not only used to display data but can also be used to collect data. This is one of the most popular plugins to create forms and display results as data or infographics.
You can use this plugin to create a whole range of different forms with varying complexity, such as column graphs, horizontal and vertical bar graphs, lines, pie charts, area graphs, histograms, stepped area graphs, geographic area graphs, heat maps and more.
Graphs can be styled using different shortcode parameters. Formidable Forms has a great set of tools to edit the appearance and style of forms and reports as well.
Key features of the plugin include:
- Drag & Drop builder that helps you build complex forms
- Templates: A great array of prebuilt templates that will greatly reduce development time
- Add-ons: About 30 addons to extend plugin functionality
- Repeater Fields – Option to collect advanced sets of data
- Advanced views – Display different types of data including calendar, list, grid, gallery, listings and more
- Payments – You can collect payments and donation using forms
- Email Marketing – Add subscribers to any of your favorite email marketing platforms
And much more…
The price of Formidable Forms starts from $79/year and goes up to $599.
This plugin is best for anyone who wants to collect and display complex data from a single dashboard.
Visualizer

Visualizer is an easy chart and table builder that lets you create interactive visualizations for your WordPress website. The plugin is created and maintained by Themeisle, a famous WordPress theme and plugins contributor, which means you can expect good quality and support from the product.
This plugin comes with 15 types of charts, although only nine are available in the free version. Additionally, it supports 12 chart types from Google Charts and six chart types from Chart.js. All the popular chart types are already included, such as pie chart, line chart, bar, donut chart, geo charts, tables, bubble and more.
Some essential features of the plugin include synchronization of chart data from the source, charts from your posts or pages, chart visibility and permission, advanced filtering and sorting in tables.
This plugin is best for beginners who want to start their data visualization journey for free and as easily as possible.
A free version is available and pricing starts from $99.
Data Tables Generator
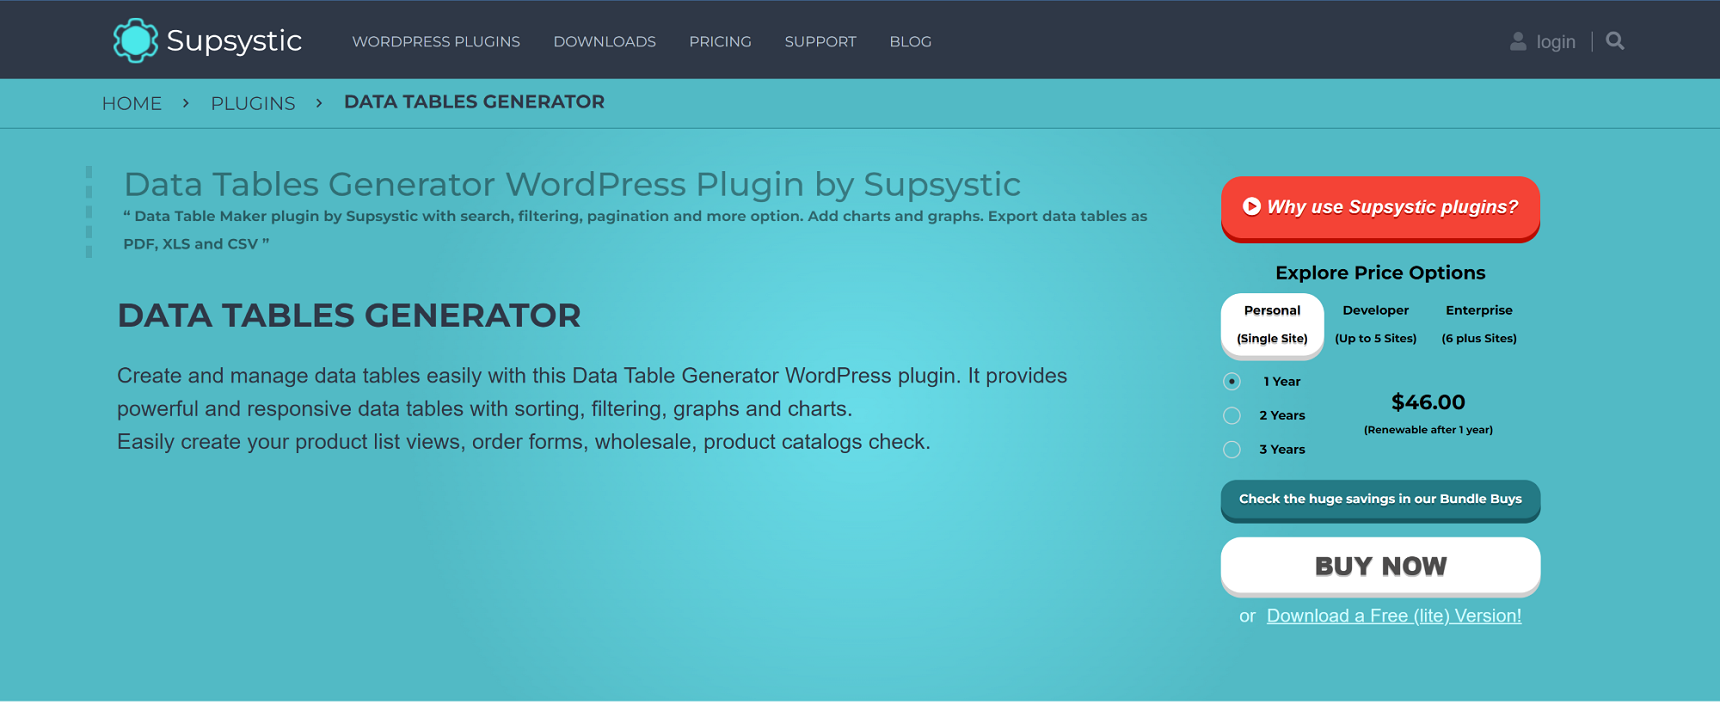
Data Tables Generator plugin allows you to create responsive data tables with great sorting, searching, pagination, filtering functions and more.
You can use this plugin even if you have no experience in data management. With this plugin you can easily showcase your data to the public using charts, graphs and diagrams generated by the plugin. Additionally, the plugin allows you to display your Google Charts data.
Data Tables Generator supports several different sources of data like Google Sheets, CSV, Excel and PDF.
Another important feature of Data Tables Generator is that it can be integrated with WooCommerce, allowing you to create product tables and show them to your users. This feature is only available in the Pro version.
This plugin is best for those who want to integrate good looking product tables into their WooCommerce store.
TablePress

TablePress is one of the most popular and widely used free WordPress data visualization plugins. With a whopping 800k installs it is the true leader of this list.
This wonderful plugin allows you to easily create and manage tables from the WordPress dashboard, then embed those tables into posts, pages or in any text widget. Table data can be edited directly in the spreadsheet-like interface, just like in Google Sheets or Microsoft Excel. Tables can contain any type of data, formulas, numbers or equations.
Data in tables is nothing without sorting and filtering. TablePress allows this as well, so you can easily find your results by filtering, sorting and paginating tables in many different ways. Of course, you also have great options to import different variants of data into the tables, and the plugin’s export options will not disappoint.
This plugin has amazing pricing options as it’s totally free, even the premium extensions. The only thing the author asks for is a donation.
Conclusion
I hope this article has done its job and now you have the information you need to choose the right WordPress data visualization plugin for your website. Of course there are many other plugins you can use for data visualization but I tried to find the most popular plugins used by thousands of customers.
If you have any questions or suggestions, make sure to share them in the comments!



No comment yet, add your voice below!