What is Inspect Element and Developer Tools?
Inspect element (or Developer Tools) is like the magic tool of modern browsers. Just right-click on any page, click inspect and voilà! Here, you will see a detailed description of the page including the following information:
- All of the HTML code that structures the website
- The CSS codes that style and shape the structure
- JS codes that power the animations
- Stats about how long the page takes to load
- The file sizes of all assets
- The order of loading files
- A console page to see the issues or hidden messages from a mischievous developer.
Everything that you need to know about the page is right here! And do you want to know the best part? You don’t have to be a geek or developer (or both) to use it. It’s for everyone! Maybe you’re a designer and want to know how your design looks on a mobile device or maybe you just want to see a different shade of a color on your new header and change the text size to make it more visible. Most importantly, your changes cannot cause any problems or break anything because all of the changes are only applied on your side.
If you’re a website owner, you may want to find out the speed of your site, just to see if your customers are having any problems accessing your website. Or perhaps if you’re a marketer, you may want to know the keywords that your competitors use. You get the point—inspect element is a gold mine for details that anyone can access! In this article, I’ll provide some useful tips about how inspect element can be beneficial for your site.
How can inspect element be beneficial for your site?
Let’s imagine that you want to change some of your text, test an image or style on your website but don’t want to create a staging environment just for that. You also don’t want to serve it to visitors either. No problem, that’s where the Developer Tools can come into play.
Here is what you can do with Developer Tools (Inspect Element):
- Change any text
- Change colors
- Finding errors on your site
- Test your site in responsive mode
- Monitor the speed of loading files
Changing Texts, Style Properties and Adding New Styles
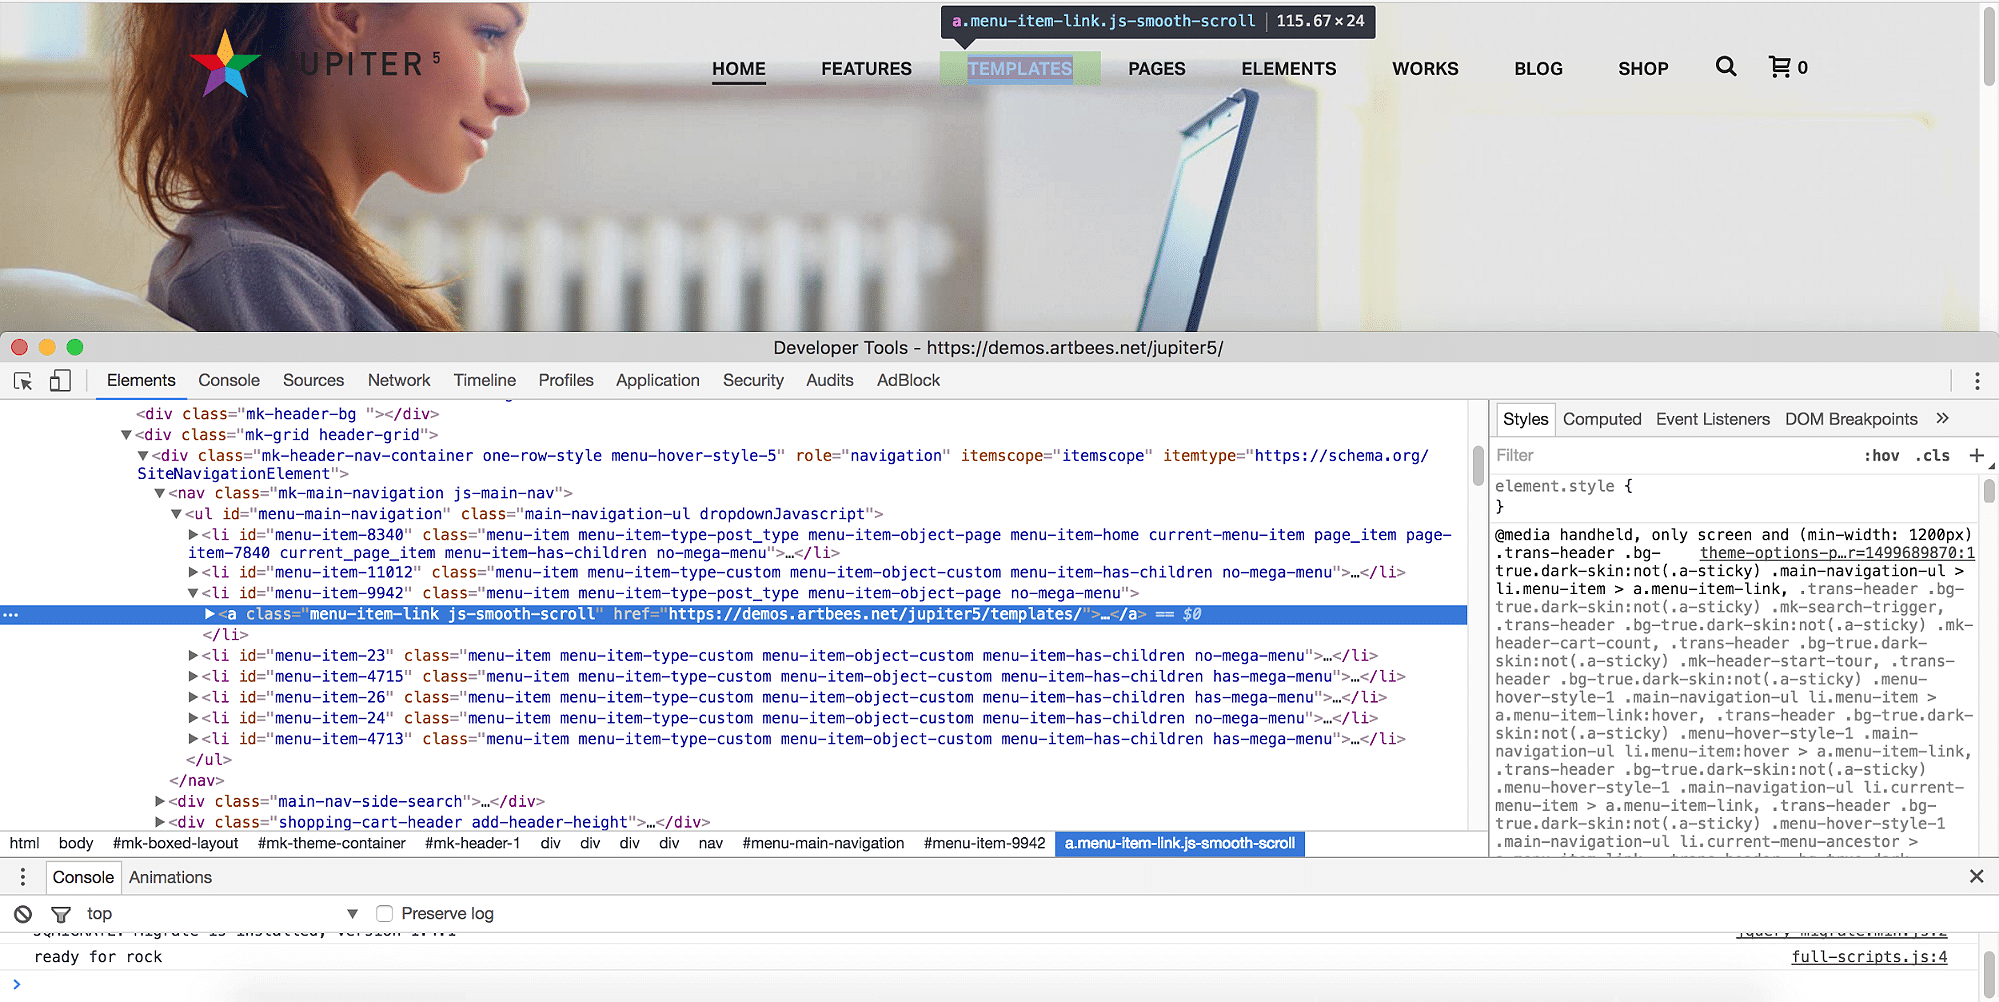
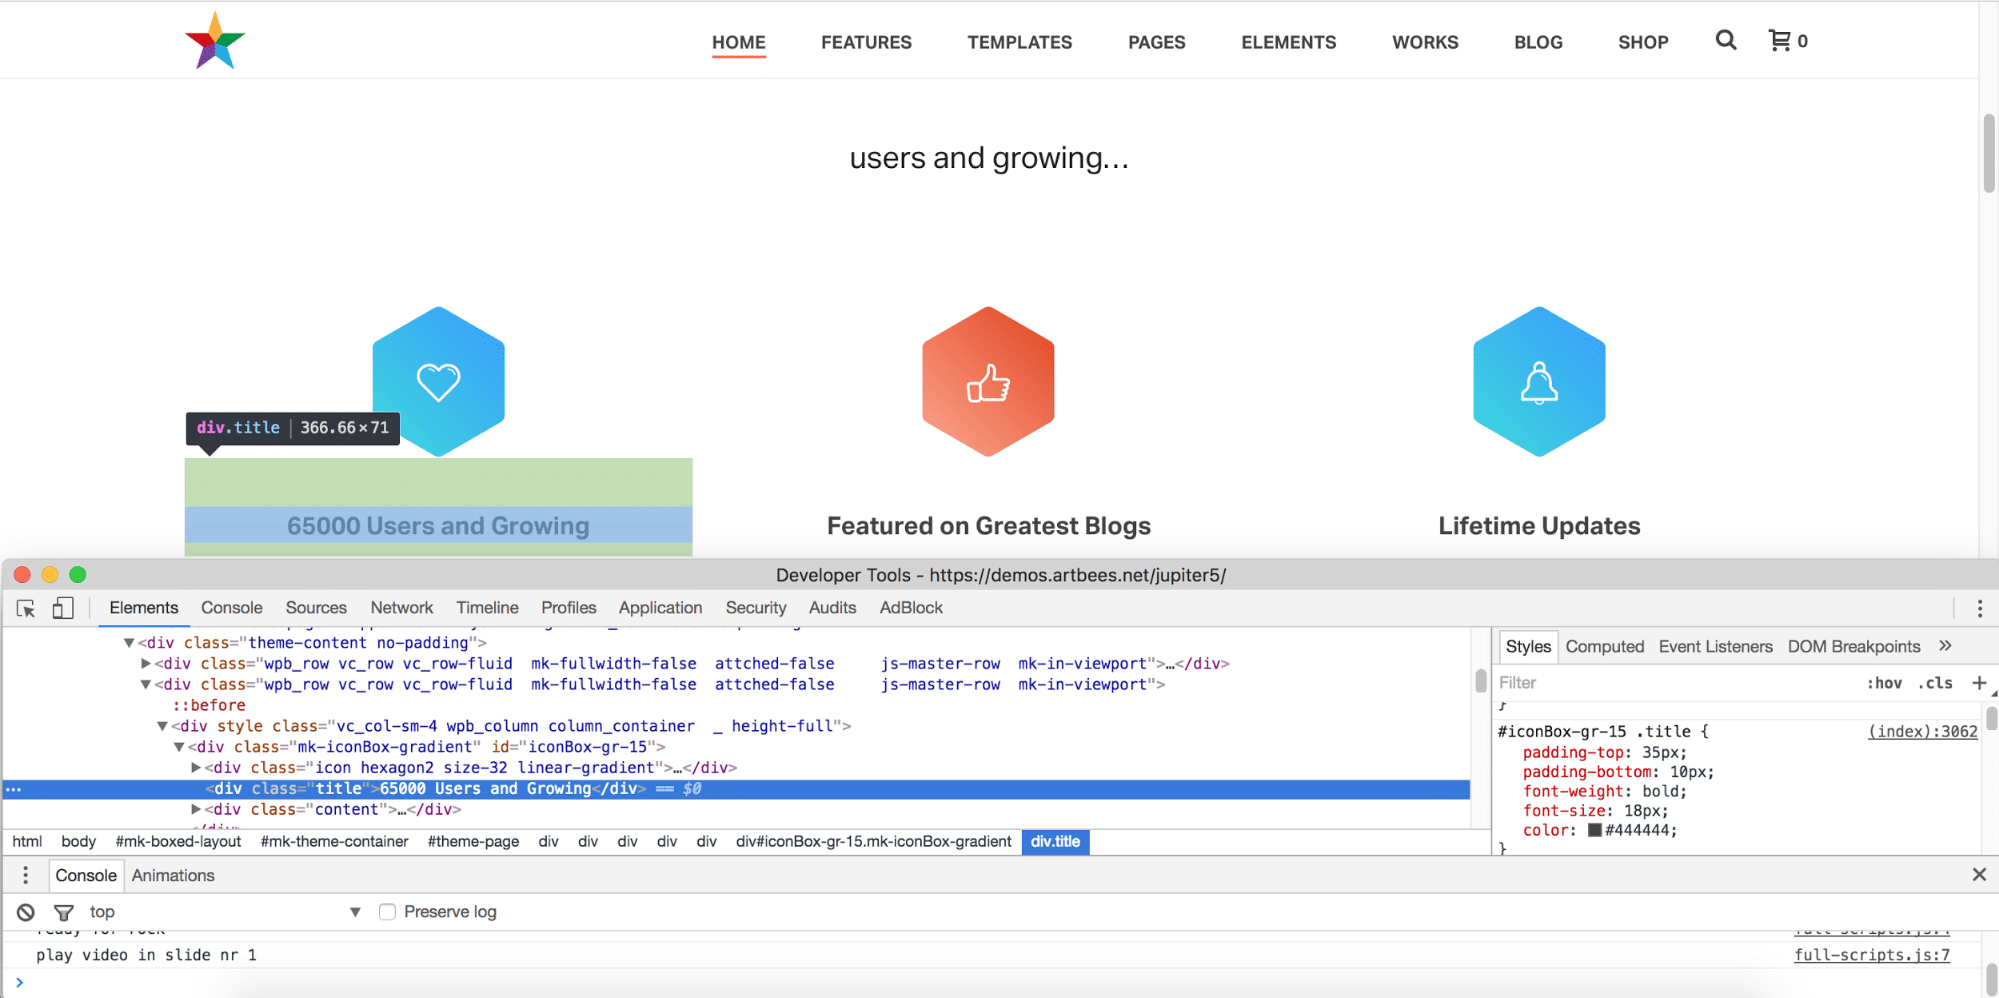
For changing texts, you can simply double-click the element in the Developer tool. Then you’ll be able to change the text directly. However, changing colors and adding new styles require different approaches. For changing styles, you have to find the right CSS classes on the right side of the Developer Tools.
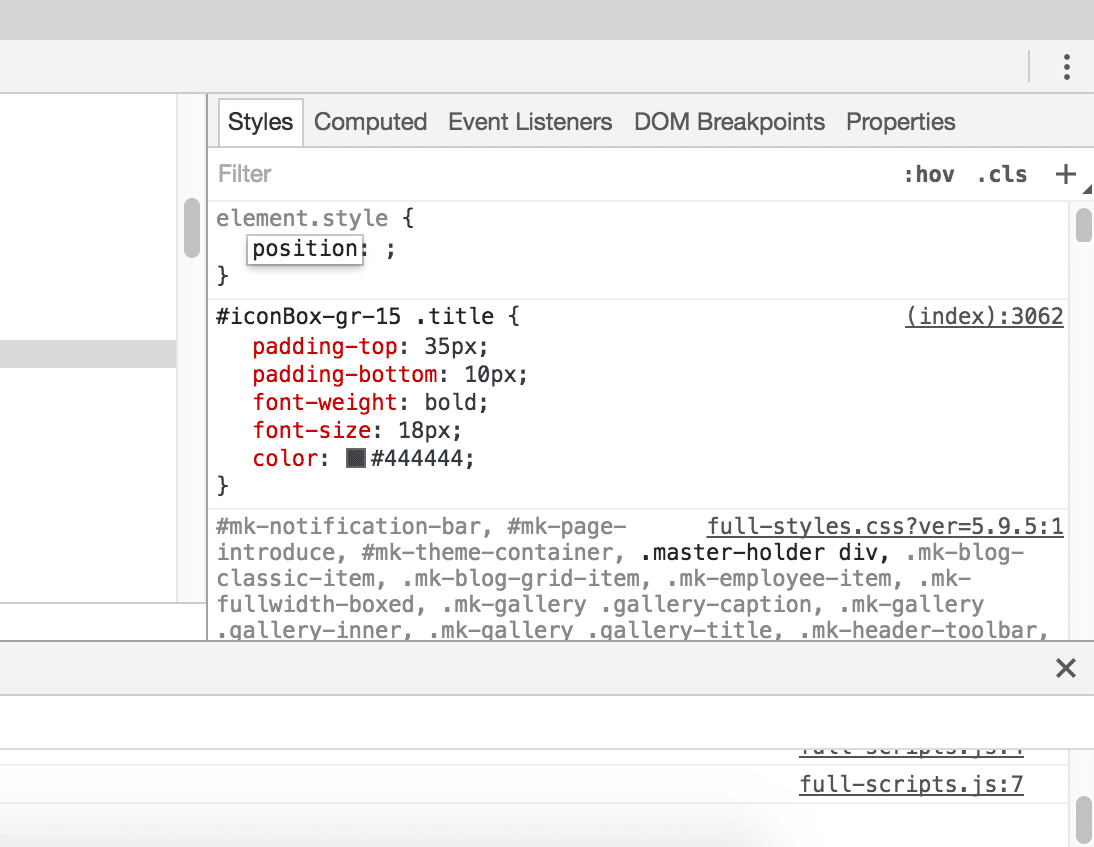
Adding new styles for the elements is easy too. You can simply click on “element.style” area which is on the right side of the Developer Tools (top area) and then you’ll be able to add your CSS properties there.
Finding Errors on Developer Tools
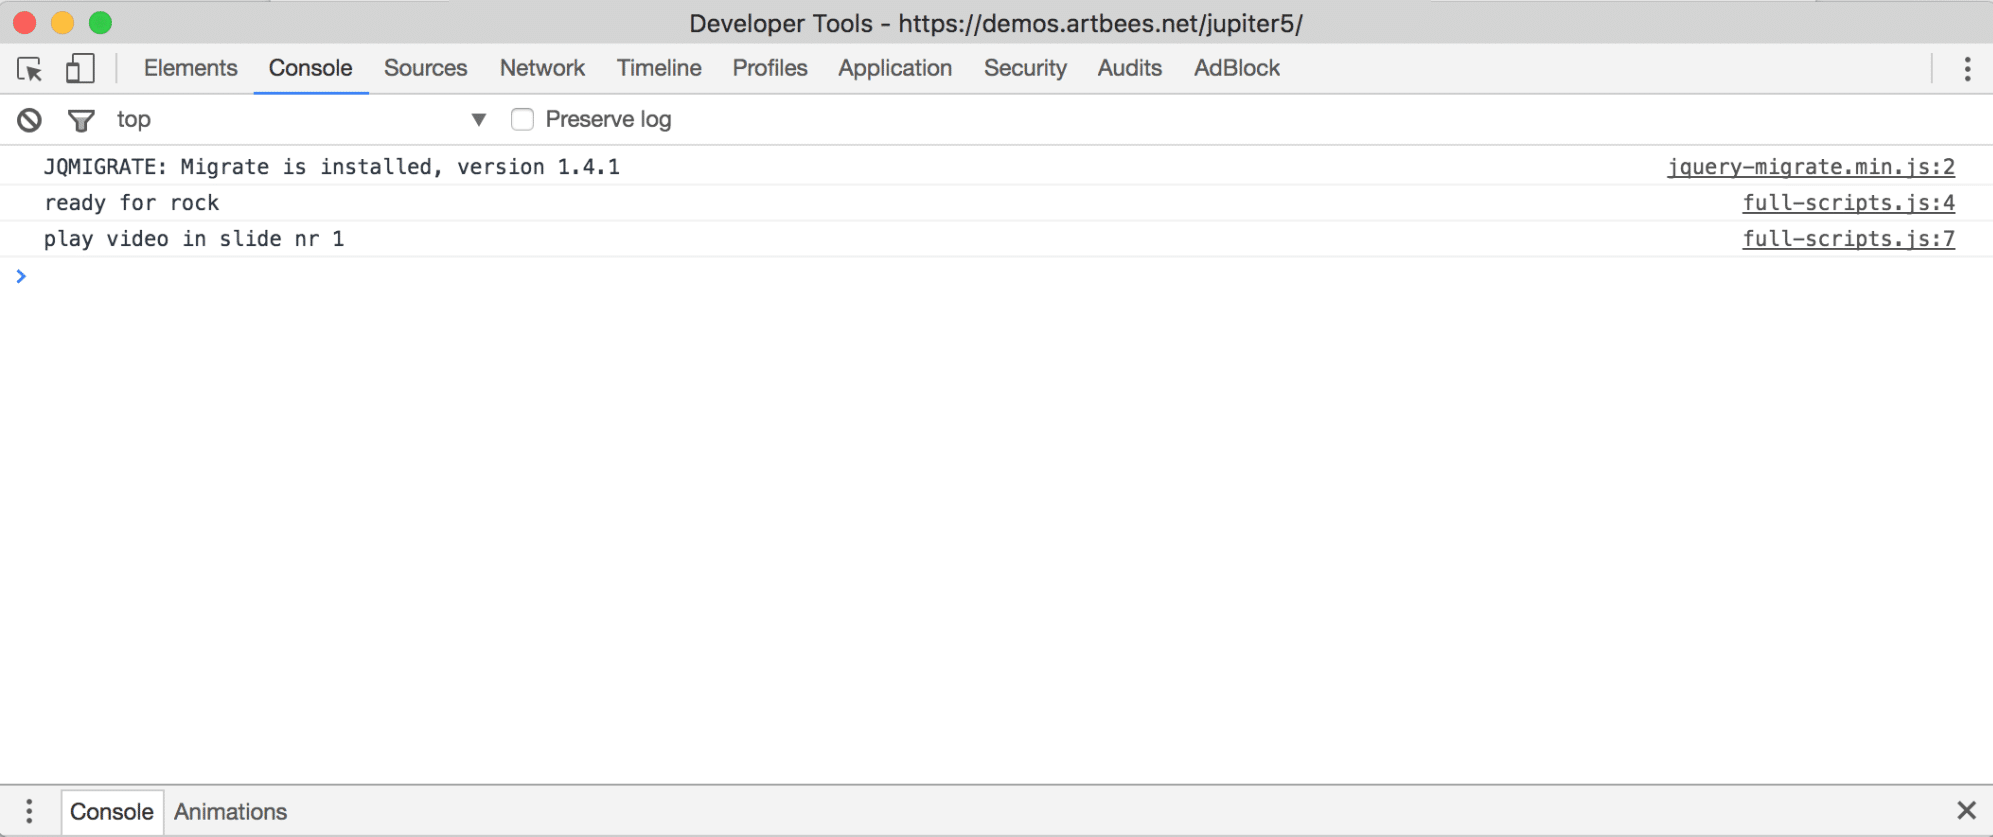
You can easily see the errors displayed on Developer Tools if you’re struggling with a problem which you can’t define. You’ll be able to see all of the errors on the Console tab in Developer Tools. If there is no error and everything works great, then you’ll see the “ready for rock” text (only in Artbees Themes).
Responsive Mode of Developer Tools
You can activate the Responsive Mode in the Developer Tools by clicking the “Phone and Tablet” icon which is placed in the upper right side of the Developer Tools. After clicking, you’ll be able to see your website in any dimension. It’s a pretty awesome feature that allows you to test your website in different dimensions.
Monitoring the Sources on Developer Tools
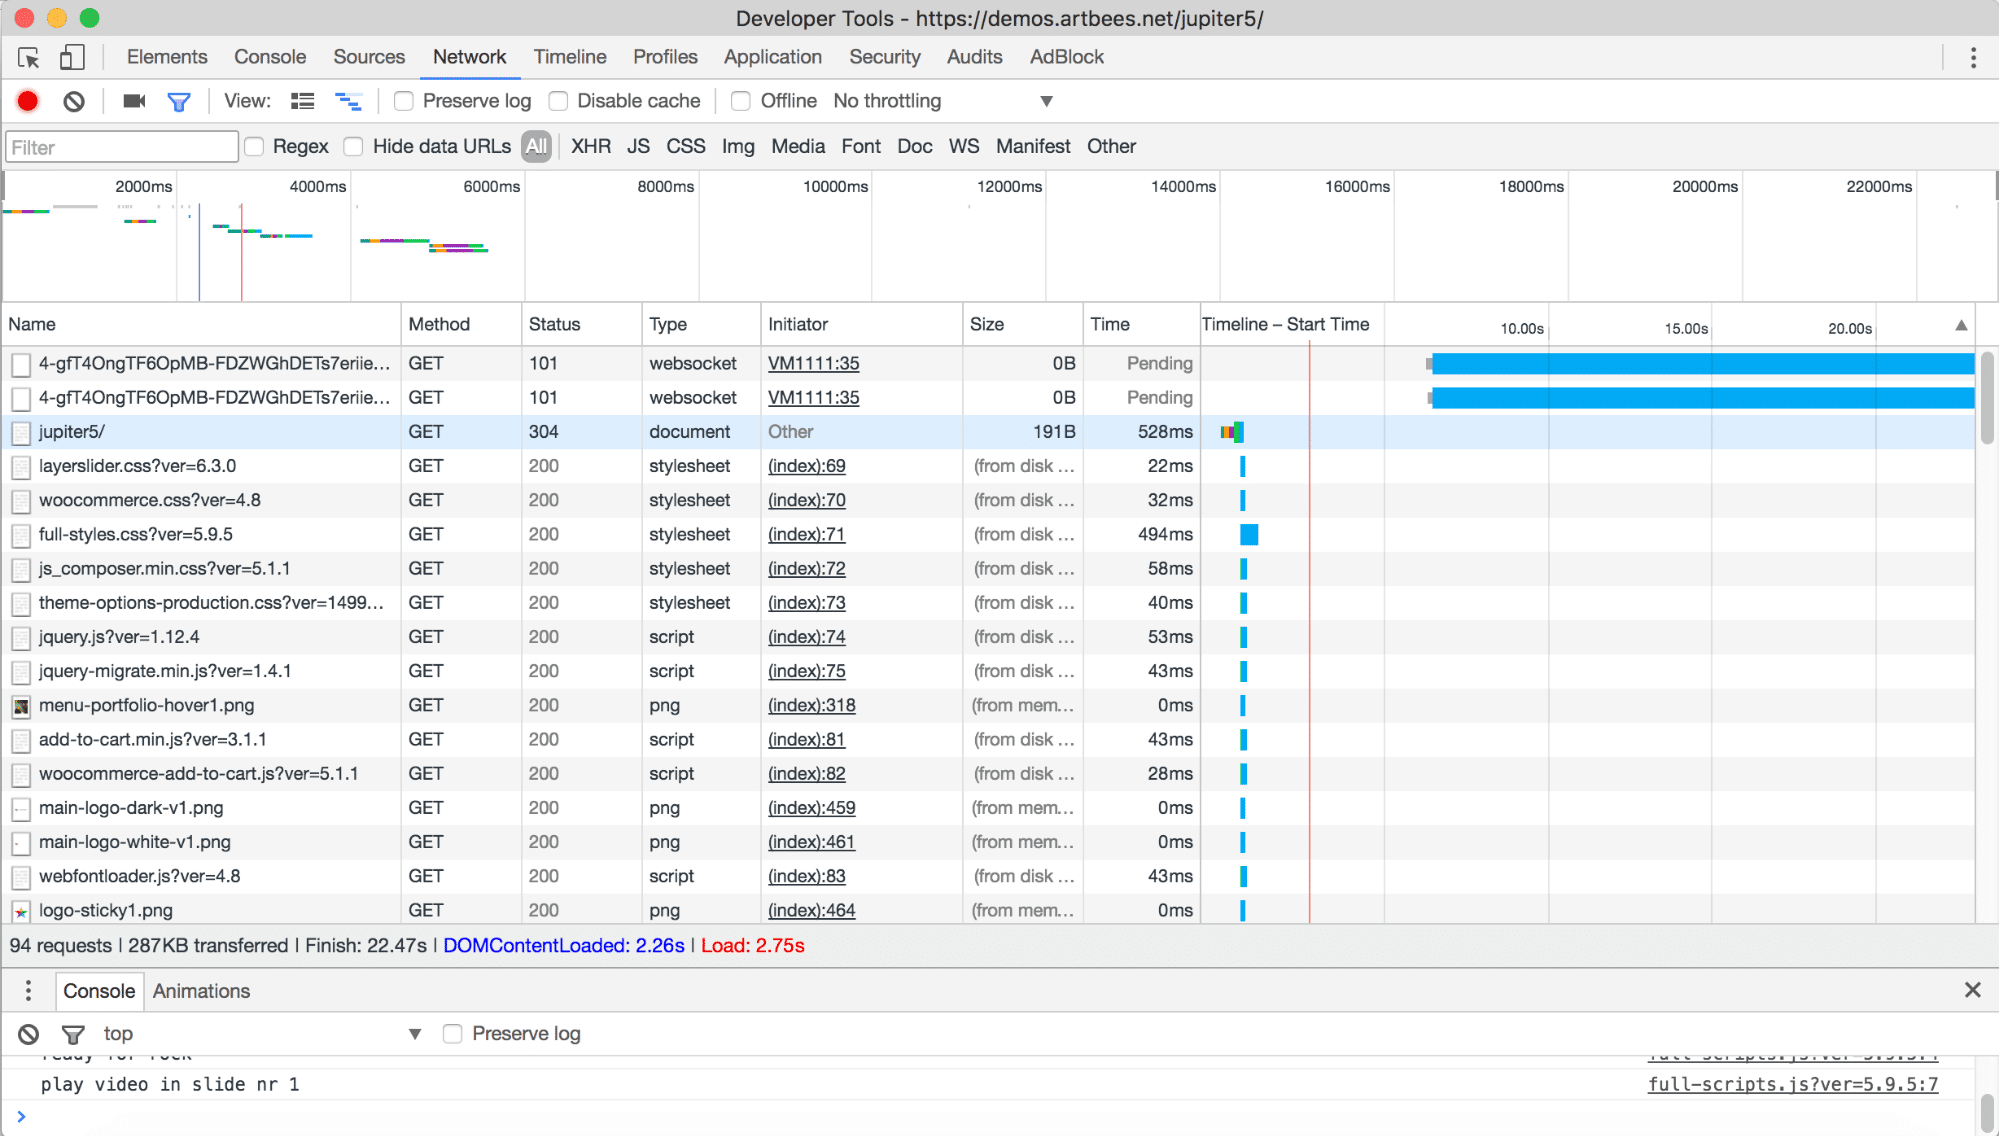
You can also monitor your website’s sources on Developer Tools like images, javascript files, CSS files, videos, etc… You can then see all of the metrics on the Network Tab in Developer Tools.
Pop the hood on your website with Inspect Element
I want to shake up the perception that only a tech-savvy developer can navigate through all of the details that make up the framework of your website. Don’t underestimate what you can do with Inspect Element and how informative the details inside can be allowing you to see what’s really behind your website’s design.




No comment yet, add your voice below!